

Cryptocurrency trading is actually quite easy and lucrative if you just stick to the fundamentals.
Cryptocurrency trading made easy
Technical analysis is one approach to evaluate the rise and fall of cryptocurrencies. By utilizing the best indicators to know the rate of digital currencies, you can make educated predictions and engage in wiser trades.
This article features the best staple technical analysis tool and the top momentum indicators. These tools are used for making predictions and knowing the present market sentiment and market trades for cryptocurrencies.
RSI indicator
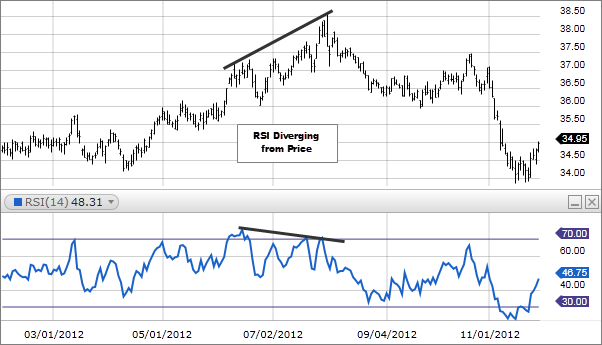 What is RSI? The Relative Strength Index (RSI) is a momentum indicator and technical trading indicator. It is the most well-known technical analysis tool because of its clear and simple outputs. It has been featured in books, articles, and interviews over the years.
RSI is used to identify the speed of price movement. It compares the latest closing price to previous closing prices. It is also utilized to evaluate the past and to make price predictions.
This cryptocurrency indicator is usually based on a 14-day time period. RSI swings between 0 and 100, and its index moves between overbought to oversold, or vice versa. When the value is above 70, RSI is considered overbought. When it is below 30, it is considered oversold. The signals can be generated if you look for centerline crossovers, failure swings, and divergencies. This indicator works by computing the momentum of the price movement, so the higher the stock means that the more positive this indicator is.
MACD Indicator
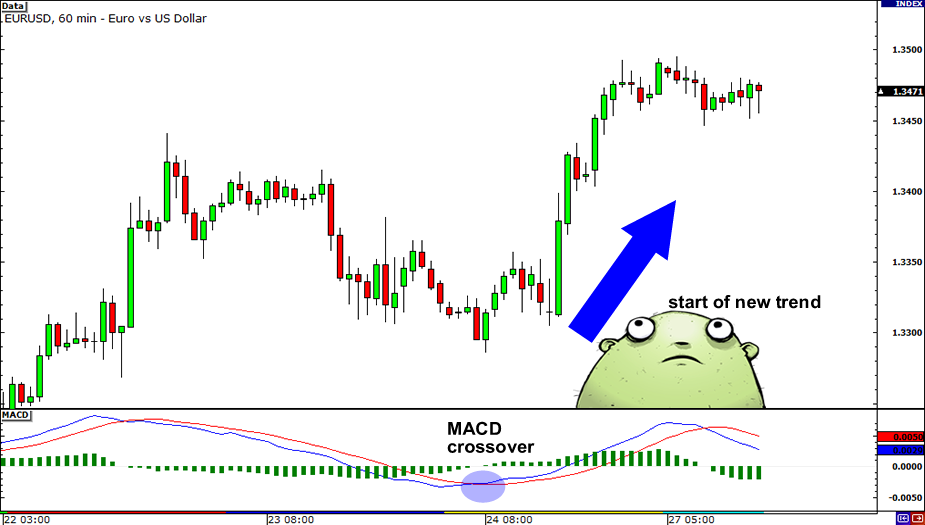 Moving Average Convergence Divergence (MACD) indicator, a fine cryptocurrency trading indicator, is based on exponential moving average (EMA). MACD is usually used with other indicators to determine exit and trading points.
Like RSI, MACD is also one of the most effective and simplest momentum indicators ever. This indicator turns two moving averages into a Decision Point Price Momentum Oscillator (PMO) by subtracting moving averages from each other. That is why you can say that MACD offers both momentum and trend following.
MACD is only about divergence and convergence of two moving averages. Divergence happens when two moving averages move away from each other. Convergence transpires when two moving averages move to meet at a point. This indicator oscillates between above and below the centerline as the moving average diverger, converge, and cross. The shorter moving average is responsible for almost all of MACD movements while the longer moving average is slower than the shorter moving average. The latter is less reactive to the difference in the cost of an asset in the underlying security. Therefore, since MACD is unlimited, it is ineffective in identifying oversold and overbought levels.
How to Profit Using MACD Indicator?
Using MACD indicator, you can experience three instances in which you can make a profit from trading calls
- Purchase signal confirmation when you see a positive divergence.
- Sell signal confirmation when the divergence is negative.
- Share prices are rising if the indicator is above the zero line. If it is below the center line, then share prices are falling.
Bollinger Bands
 John Bollinger created the Bollinger Bands, a trading indicator that emphasizes the dynamic characteristics of markets such as price signals. Bollinger Bands are used to indicate areas of resistance and support, know profitable trades, and confirm breakouts.
The Bollinger Bands are the curves found in the price structure. It usually consists a lower band, an upper band, and a moving average that indicates price rates. You can say that this indicator is most effective when the moving average reflects the intermediate-term trend. When this happens, the average price level data combines with trend information.
The %b indicator and the Bollinger bands also act as an oscillator and as a dynamic resistance and support that change with the market’s behavior.When volatility increases, the upper, lower, and middle bands widens. When the market settles, the bands thin.
How to Use Bollinger Bands in Cryptocurrency Trading?
One of the best indicators for cryptocurrency trading are Bollinger Bands.
There are two strategies that you can use. The first one is the Bollinger Squeeze and the second is the Bollinger Band: Support and Resistance.
- Bollinger Squeeze
A Bollinger squeeze occurs when the lower and upper bands tighten. They squeeze the centerline making it escape the bands. This indicates that a significant movement will occur. The large movement is referred to as a breakout.
You must trade when the first breakout occurs after a squeeze or when the first candlesticks escape. When the breakout is above resistance, purchase your chosen cryptocurrency and sell it later. if the breakout is below support or when the cryptocurrency’s price continues to drop, you must sell to buy later.
- Bollinger Band: Support and Resistance.
Like traditional resistance and support patterns, the upper part of the Bollinger Band acts as resistance while the lower part acts as a support. To put it simply, you must sell at the higher resistance and purchase cryptocurrencies at the lower support. This strategy is most effective when the bands are constricted because of the low chance of a breakout to transpire.
How to Apply Indicators in Cryptocurrency Trading?
- Open your trade screen.
- Choose your technical indicator from the options.
- Study the chart patterns and apply what you have learned from this article.
Conclusion
You are now familiar with cryptocurrency trading based on Bollinger Bands, MACD, and RSI. Therefore, you are now considered an up-and-coming crypto trader capable of profiting from trades based on rational analysis.
For more on cryptocurrency trading, check out www.icoinpro.com

Comments (No)